Flocculation and transport of fine sediments in rivers and coastal environments
Flocculation (aggregation of particles) plays a key physical role in the dispersal and settling of fine sediments within aquatic environments by affecting the size and settling velocity of particles over time. Yet, many of the intricacies of the flocculation process remain poorly understood. In particular, a common approach is to assume that ‘flocs’ are in equilibrium with the local environment (such as turbulence field and stratification). However, it has been shown that sediments retain ‘memory’ of previously encountered upstream conditions, which affects their response to local conditions.

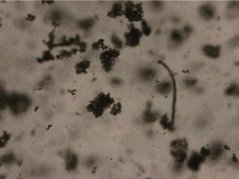
We obtained some beautiful floc images from the cameras which worked extremely well up to around 300 g/L. Here’s an example image:

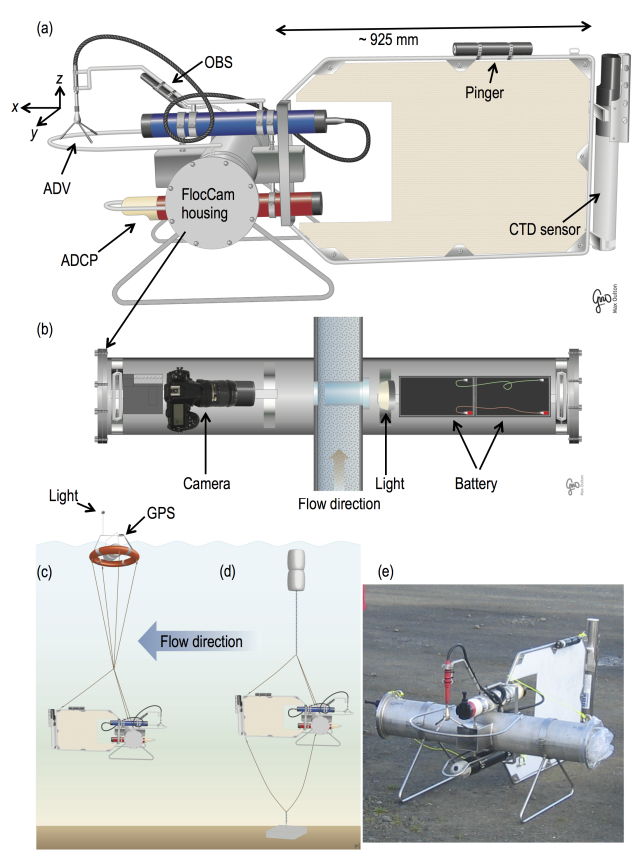
Together with collaborator Iain MacDonald from NIWA and PhD student Berengere Dejeans, we are investigating the physical controls on flocculation along a tidally influenced river. Field measurements were made in the heavily sediment-laden Kaipara River in New Zealand. We used subsurface ‘FlocDrifters’, which are novel purpose-designed drifters equipped with an underwater floc camera system, an ADCP for velocity and turbulence measurements and a CTD probe. These ‘FlocDrifters’ were used in both Lagrangian (flow-following) and Eulerian (stationary) modes (see image to the left).
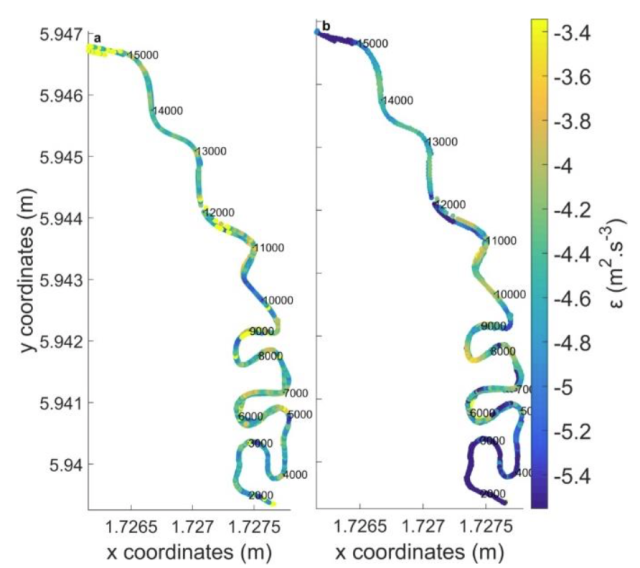
Former PhD student Berengere Dejeans worked on developing a numerical model of the system and is assessing model performance by comparing predicted turbulence levels to the observations. In general, the model is found to be able to reproduce the right order of magnitude of dissipation rates. However, turbulence characteristics in some sections of the river, usually in the vicinity of abrupt bends, are relatively poorly reproduced. These results have been published in Water Resources Research (Dejeans et al. 2022) and Berengere also won the 2017 New Zealand Coastal Society Student Award for this paper (great work Berengere!). The image here shows a) Observed and b) predicted distribution of energy dissipation rates along the river. The numbers along the river are the along-river distances (from an upstream reference point).
